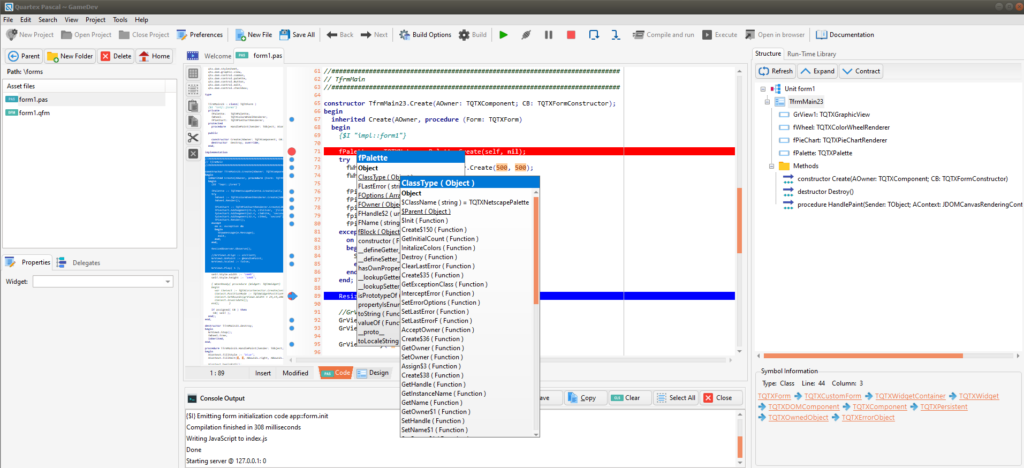
This has been a long time coming but it’s finally time for a new backer build! There have been a long list of improvements, so this bould should do wonders – and ofcourse, this version has the long awaited debugger included.

Before you download
For some reason Microsoft Onedrive caused a few problems. I am unsure if this is purely on my machines or a general “thing”. The debugger will always create it’s own debug session with the browser, which involves it’s own cache (which it deletes after use, to make sure there are no old files in the cache being used). But if you have Onedrive installed, the “My Documents” path we get back from the OS is mapped to /OneDrive – which cannot be written to. Not even when running the application as administrator.
Until we figure out what that is, the temporary cache is set to a sub-path where the exefile is stored. Which would be “C:\work\QuartexPascal\bin\tempcache\QuartexPascal\Debug\Chromium\UserData\” (phew!). So you wont notice anything really. It was just curious that Onedrive refused to let us create folders – considering it hijacks the OS default path to the user’s home directory.
I even uninstalled OneDrive and rebooted my development machine, but the /onedrive/ path was still returned by Windows. So I suspect Microsoft never imagined that anyone would uninstall the damn thing.
Using the debugger
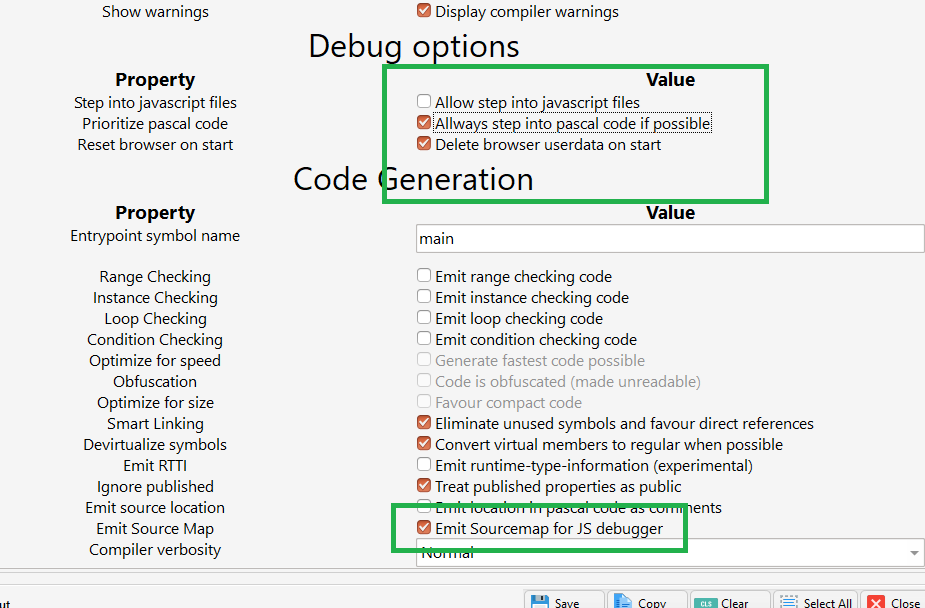
You can make a choice if you want the debugger to jump into the JS (showing you the JS) or if you want to be shielded from the JS as much as possible. The default is to have the “allow step into javascript files” option UN-CHECKED.
While not needed, you can also check the “Emit sourcemap for JS debugger” if you want to use the developer-tools in Chrome directly. If you just want to debug the pascal directly in chrome — just run your code with “open in browser” (you dont need our debugger then), open the developer tools – and off you go. Chrome will then show you pascal code rather than the JS code.

Also note that there is a small delay after you stop the debugger (or close the Chrome / Edge instance) until focus returns to the IDE. Not much, but it’s good to be aware of it. This has to do with the WebSocket termination when closing the debug protocol session.
What I did notice at one point was, that when i closed the browser and immediately started a new session – the debugger was unable to attach to the process (it was still shutting down from the previous session). We are talking seconds here, so just want to mention it in case your breakpoints go out of sync. Just stop the debugger – wait for a couple of seconds, then run it again.
Download
The download link has been published at the ordinary place — so download & enjoy!